
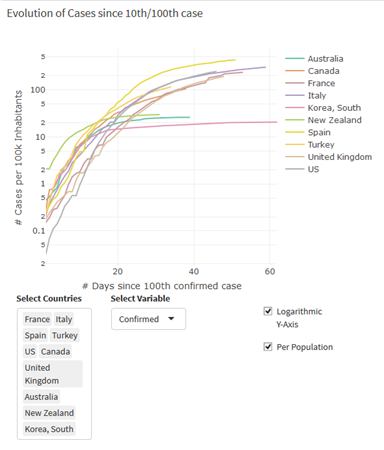
Many of us have an interest in following “the numbers” for COVID-19, not least because what happens from here may have impacts on our own health and well-being. Last week, I sent you the plot that is attached below and it occurs to me it might need a little explanation. The numbers below refer to the situation on 23 April.
- The plot shows the total number of confirmed cases for each country, standardised by population. For example, we have 6800 confirmed cases for 25 million people, so the number “per 100,000” is 6800/250=27.2.
- The vertical axis is on what is known as a “log scale”. What this means is that it is on a multiplicative scale, so the axis is marked in equal increments that are labelled 1,10,100,1000, so each equal increment corresponds to a factor of 10. The reason for this is that epidemics like this tend to grow at a multiplicative rate – if each person infected gives the virus to 2 others, say, then there will be 3 infected; if those 2 each give it to 2 others, there will be an extra 4, making 7; those 4 give it to 8, making 15; the 8 give it to 16, making 31; and so on. It basically doubles at each “generation” of the virus. If we use this “log scale”, the doubling will come out as a straight line. A really steep straight line, such as the early days for Spain, Italy, UK, US, represent about a 30% increase each day, so that the numbers doubled every 3 days. That’s what happens here without any constraints. With social distancing, the line flattens (flattening the curve), so reducing it to a 10% increase per day leads to a doubling every 7 days. The aim of course is to get the % increase as low as possible. We are now below a 1% increase per day.
- The lowest curve is South Korea (I haven’t shown China since I don’t believe their numbers!). But Australia and NZ have similarly flat curves out to the right and very low infection rates overall. Its perhaps hard to see in this plot but Spain is at the top followed by Italy. The US and UK are not far behind but, worryingly, they are still going up quite steeply (about 10% per day).
- I haven’t given the numbers of deaths here but that tells an even stronger story. In Australia, we have about 70 deaths. The US is 14 times our size, so if they were on a par with us they would have about 1000 deaths. But they have 40,000 deaths, so it is reasonable to suppose that their infection rate is about 40 times as high as ours. (Part of this high death rate may be due to them not being able to care for patients so well because of the enormous patient load).
- In Australia, the death rate is close to 1% of confirmed cases and we believe we probably have recorded most of the symptomatic cases (asymptomatic cases are another story!). On that basis, 40,000 deaths in the US would equate to about 4 million symptomatic cases, whereas their testing only gives about 800,000 confirmed cases. This is a measure of how poorly resourced their testing has been relative to ours. Unhappily, when you repeat these numbers for the UK, it is even worse.
- Why did we do so much better? It is pretty clear that the virus in the US and the UK started really getting going about 3-4 weeks earlier than it did in Australia and NZ. Prior to social distancing, it doubled about every 3 days – say, 4 times in one week, 16 in 2 weeks, 64 times in 3 weeks – and we “locked down” about the same time as the US, so it is not surprising that they have 40 times as many cases as we have. They needed the lockdown to occur about 3-4 weeks earlier than they did. Trump and Johnson were missing in action and didn’t take it seriously until far too late. We also had the great advantage of a coordinated response AND adequate protective materials (at least partly because of the much smaller load on the system).
- If there are 4 million symptomatic cases in the US now, and many more that are asymptomatic, it is quite possible that the US will end up in a few months with 50% of the population immune to the disease and then herd immunity starts to kick in and it will gradually die out there. That is a problem for us. If we wipe it out in Australia and NZ but only 1-2% have immunity, then we have an almost complete population that is vulnerable. In the absence of a vaccine, that is particularly dangerous. It means that any outbreak can escalate very quickly, especially once we have relaxed those internal controls. I think it will be a good while before we will be able to open our borders.
In some respects, this is very encouraging, but we can also see that there are dangers ahead if we let down our guard.